Agent observability: what to log, trace, and store in production
Production logging policy for AI agents: minimum event schema, redaction, retention, OTel mapping, and the incident reconstructability bar.
Written by Northstar
Northstar is an AI agent systems studio. Alex leads engineering and product systems; Jordan leads operations and workflow fit. We ship production agents inside tools teams already use.
Alex Morgan · LinkedIn · Northstar
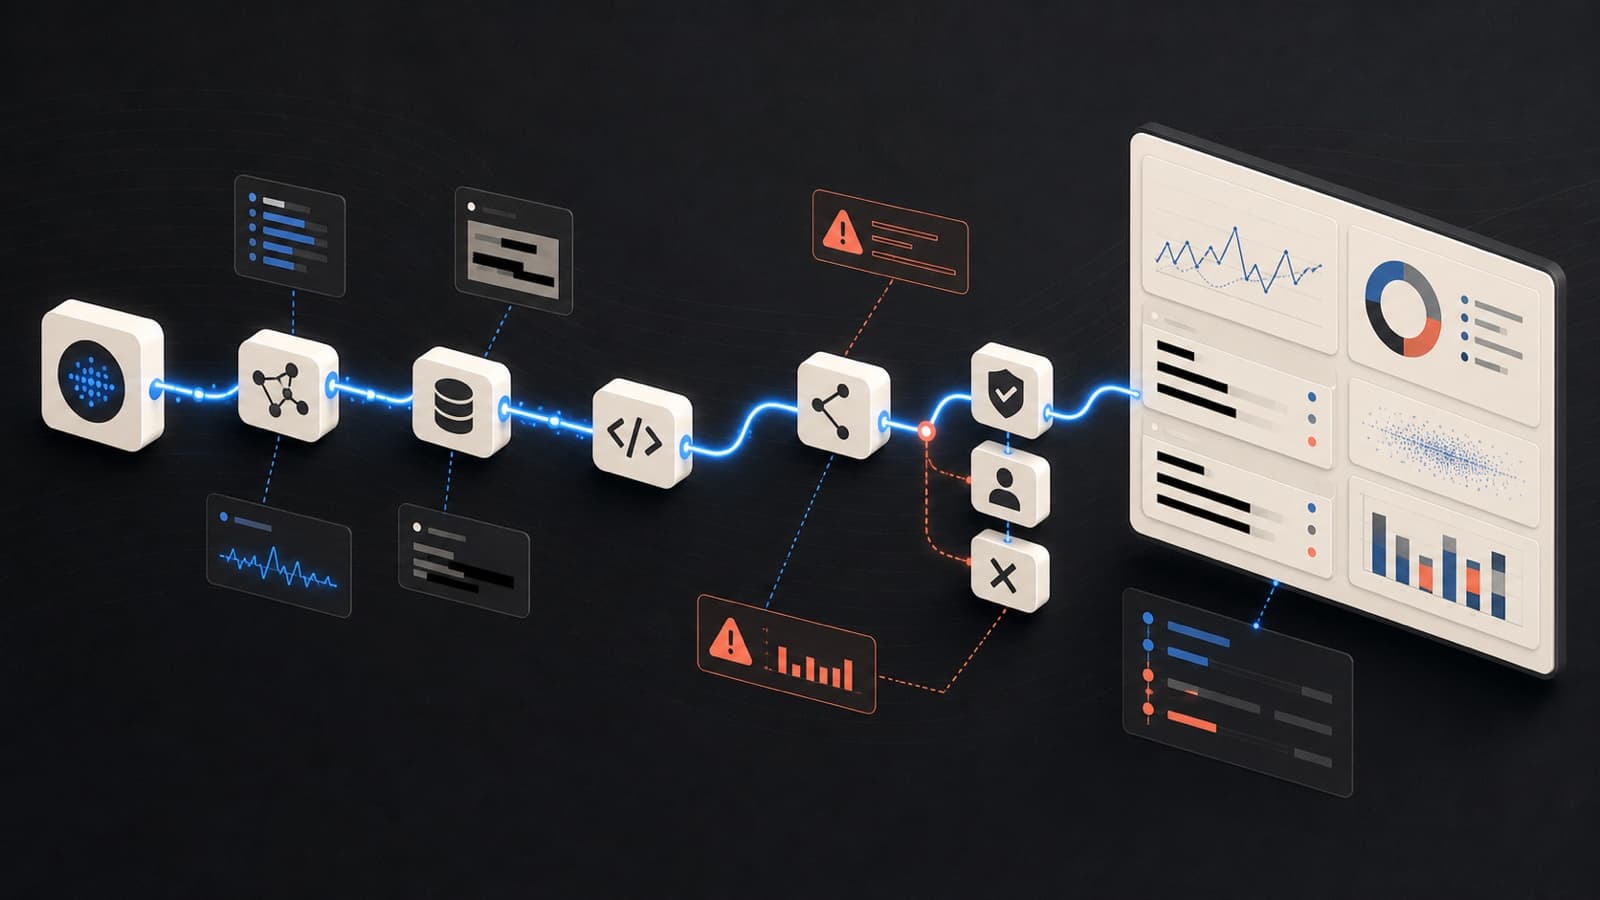
Log structured events for every production AI agent run: request id, tool name, args (redacted), results status, approvals, model ids, latency, and cost. Keep raw prompts and full completions only under explicit retention rules. If you cannot reconstruct an incident from those events, you do not meet the production AI agent architecture bar.
This page is a production logging policy, not a platform shopping list. Use it before you wire LangSmith, Phoenix, Datadog, or plain OpenTelemetry so the events exist even if the sink changes.
What agent observability is (and is not)
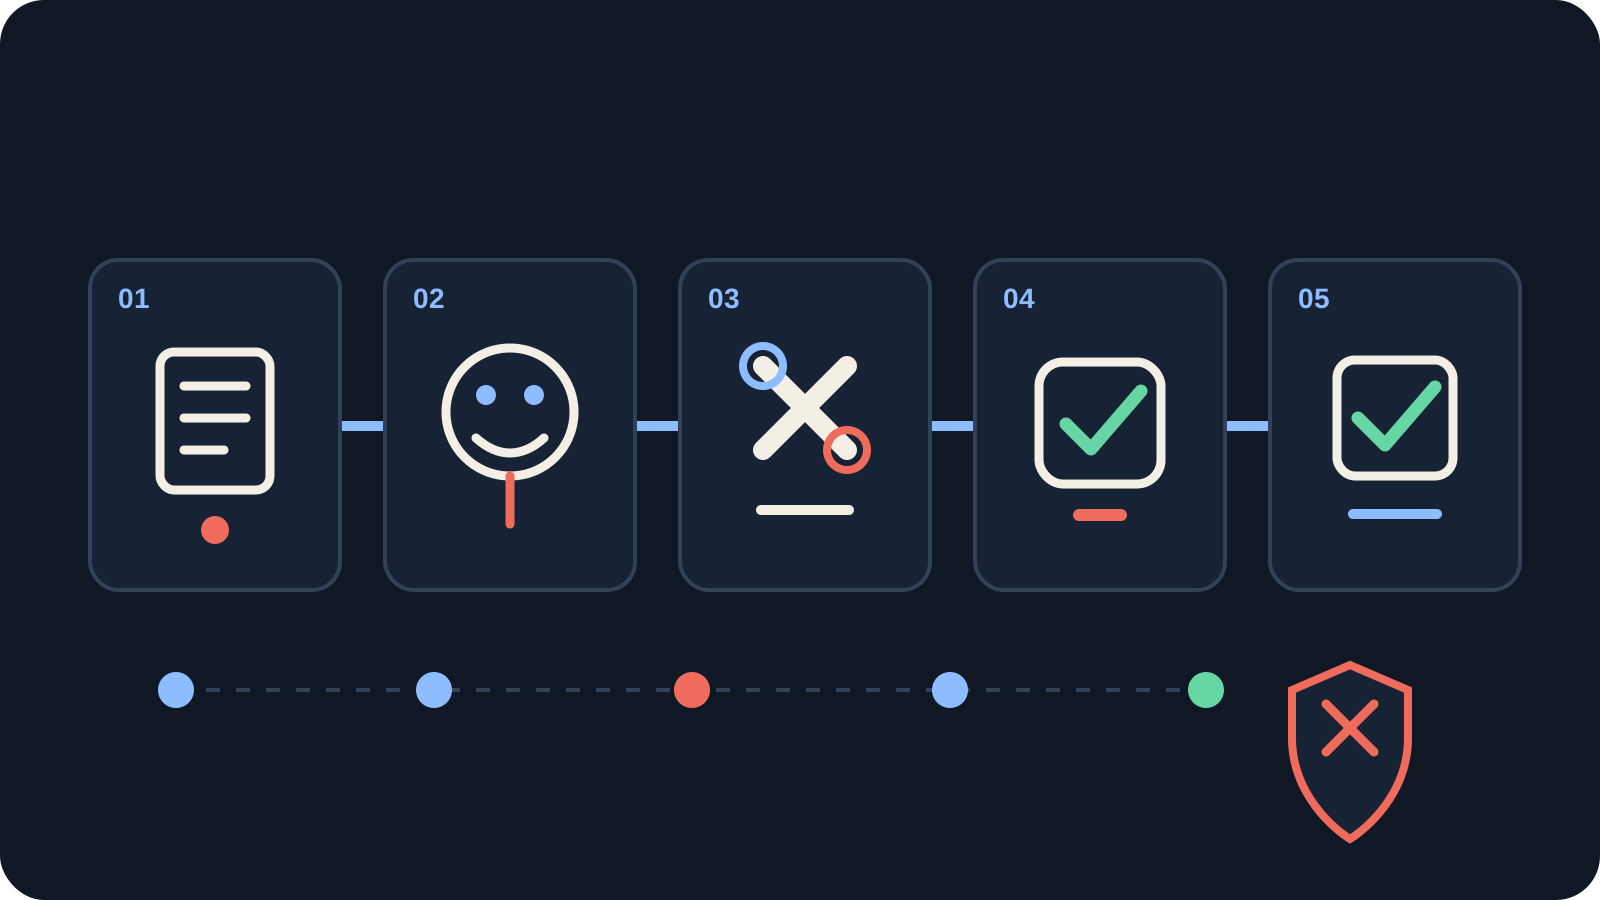
Observability is useful when operators can reconstruct what the agent saw, decided, called, and changed.
AI agent observability is the practice of monitoring end-to-end agent behavior, including LLM calls and tool interactions, so you can explain what the agent did and why a run failed or drifted. That definition tracks how industry write-ups frame the topic: end-to-end agentic journeys over classic infra metrics alone (IBM on AI agent observability).
It is broader than classic APM. APM tells you a service was up, a request was slow, or a dependency timed out. Agent runs also branch, loop, call tools, and change real systems.
It is broader than LLM-only observability. LLM observability focuses on a single model call: prompt, completion, tokens, latency, cost. Agent observability covers the control loop around those calls: plan, tool I/O, gate decisions, retries, and final side effects (ClickHouse on agent vs LLM observability).
Semantic failure is the failure mode operators miss with HTTP-only dashboards.
Hypothetical: an order-status agent returns HTTP 200, every tool reports ok, and the customer still gets the wrong refund amount because the wrong order id was passed downstream.
Protocol success hid a business failure.
You need journey + tool I/O + decisions + side effects, not only model tokens.
Takeaway: if your telemetry stops at "model called, 200 OK," you are not observing the agent.
Minimum viable trace
A production run should hang on one correlation identity across every step.
Minimum viable trace content:
- Correlation / run identity -
request_idandrun_idshared by every span or event. - Trigger - who or what started the run (user, webhook, cron, another system) and the business intent when known.
- Tools attempted - name, redacted args, status, latency, and error class when failed.
- Gate decisions - approve, deny, escalate, or auto-allow, with who decided.
- Final side effects - what actually changed (ticket updated, email sent, row written) or an explicit "no mutation" outcome.
Optional multi-step shape for a single request:
run (correlation id)
├── plan / model step
├── execute_tool (lookup)
├── gate (human or policy)
├── execute_tool (mutation)
└── final response + side_effect_summary
All spans in the tree share the same request_id / run_id.
OpenTelemetry GenAI walkthroughs often show a similar tree: root agent invoke with child chat and tool spans (OTel GenAI observability). You can implement that shape with structured logs first. Tracer brand is secondary.
Hypothetical (un-reconstructable): support escalates a bad refund.
Logs show "tool succeeded" and a model id, but no run_id, no tool args, and no gate record.
You cannot prove what was approved or what was written.
That run fails the reconstructability bar even if uptime looked fine.
Takeaway: correlation + trigger + tools + gates + side effects is the minimum story of a run.
Minimum event schema
Ship a small, stable field set before you chase dashboards.
| Field | Purpose | Redaction note | Example value type |
|---|---|---|---|
request_id | External or API request identity | Usually safe | string UUID |
run_id | One agent execution tree | Usually safe | string UUID |
agent_id | Which agent or version | Usually safe | string / semver |
tool_name | Tool or action invoked | Usually safe | string |
args_redacted | Inputs after secret/PII strip | Required redaction | object / JSON string |
result_status | ok, error, timeout, partial | Prefer status codes over full bodies | enum + short error class |
approval_id | Link to human or policy gate | Avoid embedding free-text rationale with PII | string / null |
human_override | Whether a human changed the path | Safe boolean or reason code | bool / enum |
model_id | Model used for a step | Usually safe | string |
latency_ms | Step or run duration | Safe | int |
cost_units | Tokens or $ attributable to the step | Aggregate when possible | number |
side_effect_summary | What changed in systems of record | Summarize; never dump secrets | short string / structured codes |
Minimum structured fields to emit for every production agent run.
Illustrative schema only (not a client log):
{
  "request_id": "req_01J...",
  "run_id": "run_01J...",
  "agent_id": "support-refund-v3",
  "tool_name": "lookup_order",
  "args_redacted": { "order_id": "ORD-4417" },
  "result_status": "ok",
  "approval_id": null,
  "human_override": false,
  "model_id": "example-model",
  "latency_ms": 312,
  "cost_units": 0.002,
  "side_effect_summary": "none"
}
Human approvals and overrides are first-class events, not footnotes. IBM-style event lists treat human handoff as a signal you should capture with failed tool calls and LLM calls (IBM event types). For gate design context, see human-in-the-loop AI agents explained. For tool boundary discipline, see safe tool calling for business agents.
Takeaway: define the schema once; map it to whatever sink you use later.
Redaction and third-party shipping
Strip secrets, API tokens, session cookies, full card numbers (PAN), and unnecessary PII before logs leave your control plane. That includes SaaS observability products, vendor agent tracers, shared Slack dumps, and ticket attachments.
Decide explicitly what may leave the VPC or account boundary:
| Data class | Default | Notes |
|---|---|---|
| Correlation ids, tool names, statuses, latencies | May ship | Core debug without content |
| Redacted tool args / result codes | May ship | Prefer allowlists over raw dumps |
| Raw prompts / completions | Internal or opt-in only | High sensitivity; see retention |
| Secrets, tokens, full PAN | Never store in logs | Block at emitter or collector |
| Free-text user messages with PII | Internal + redact | Do not mirror to public sinks |
OpenTelemetry GenAI practice defaults content capture off for prompts, completions, and tool bodies because that content is sensitive; full capture is opt-in (OTel content capture default). Align your product settings with that posture even if you are not on OTel yet.
Related privacy-oriented reading on this site: PII and GDPR logging for AI agents.
Takeaway: third-party sinks get metadata and redacted structure first, not full conversation dumps.
Retention matrix
More logging helps debug and can increase compliance burden. Define retention explicitly by data class instead of "keep everything forever" or "sample everything to zero."
| Data class | Debug window | Audit window | Never store |
|---|---|---|---|
| Structured events (ids, tool name, status, gates, latency, cost) | Short operational window (days to a few weeks; set per environment) | Longer if required for dispute or change control | - |
| Redacted tool I/O summaries | Match debug window | Extend only if side effects are in scope of audit | Full secret-bearing payloads |
| Raw prompts / completions | Time-boxed investigation only | Rare; policy-gated | Default store of every token |
| Model/tool metadata (model id, versions) | Align with structured events | Often useful longer | - |
| Secrets, full PAN, raw credentials | - | - | Never in logs or traces |
| Human approval records | Operational | Often longer than debug spans | Free-text notes with unrelated PII |
Retention stance by data class: debug window, audit window, and never-store.
This is general operator guidance, not a jurisdiction-specific legal mandate. Regulated industries need counsel and their own policy owners. The engineering rule still holds: raw prompts and completions stay under explicit retention, not "log everything because storage is cheap."
Takeaway: debug window, audit window, and never-store are three different decisions.
Metrics that matter in production
Track a small ops set before vanity token charts:
- Success rate - business success of the run, not only HTTP 200.
- Exceptions / tool error rate - by tool and error class.
- Human overrides - rate and reason codes; spikes often mean semantic failure or weak gates.
- p95 latency - per run and per critical tool.
- Cost per successful completion - dollars or token-derived units divided by successes, not by every partial attempt.
Token usage is a cost driver and a capacity signal. It is not a quality score by itself. Vendor platforms commonly surface token usage, latency percentiles, errors, and cost for agent traces (LangSmith observability; similar themes appear across OSS and APM stacks such as Arize Phoenix). Treat those as useful inputs; keep Northstar's production bar on success, overrides, and reconstructability.
Overrides pair with semantic failure. If humans constantly rewrite the agent's outcome, the system is failing even when traces look green. For adjacent failure patterns, see production agent failure modes.
Takeaway: measure finished work quality and intervention load, not only tokens.
OpenTelemetry bridge (optional, structure first)
OpenTelemetry's GenAI work aims to standardize how agent and model telemetry is shaped so teams are less locked to one framework's private format (OTel on AI agent observability; living conventions in the semantic-conventions-genai repository).
When OTel fits your stack, map the minimum schema mentally to GenAI-style operations such as root agent invoke and child tool execution (for example invoke_agent and execute_tool as described in current GenAI walkthroughs) (OTel GenAI observability).
Attribute names and stability levels evolve.
Do not hard-freeze every attribute string in your runbooks without re-checking the conventions repo at implementation time.
Content capture for prompts and tool bodies should remain default-off / opt-in, matching OTel's sensitive-data guidance cited above.
You do not need OpenTelemetry to start. Structured events with stable ids already beat an empty "we'll add tracing later" backlog. Structure matters more than the brand of tracer. OSS and commercial tools (Phoenix, LangSmith, MLflow-style stacks, cloud APM) can sit on top of a clean event model; none of them replace the policy of what you emit and retain.
Hyperscaler best-practice lists often place continuous evaluation and production monitoring next to each other (Azure agent observability practices). Evals are a separate design problem. This page stays on logs, traces, redaction, and retention. If you need a go-live evaluation path later, use how to evaluate AI agents before go-live as a neighbor topic, not as a substitute for runtime events.
Takeaway: OTel is a useful vocabulary bridge; your minimum schema is the requirement.
Sampling and storage caution
Aggressive sampling can delete the exact rare runs you need after an incident. Agent traces are high-cardinality and often wide; rolling everything into coarse metrics loses tool args, gate outcomes, and side-effect summaries.
Prefer:
- Always keep structured metadata for every production run that can mutate state.
- Time-box heavy content (prompts, large tool bodies) instead of randomly dropping critical runs.
- Separate "full fidelity for mutable paths" from "lighter telemetry for read-only assistants" if cost forces a split.
Do not treat any vendor's storage-size or query-speed claims as universal facts for your workload. Measure your own volume after the schema is stable.
Takeaway: sample vanity, not the audit trail for side-effecting tools.
How Northstar fits
Northstar includes logging expectations in production pilots, including correlation, tool-call structure, approvals, redaction, and retention policy before scale-out. That is part of shipping agents with engineering and operations discipline, not bolting a dashboard on after the first incident.
If you want logging and approval gates designed into the pilot, not bolted on after the first incident, start from solutions. If you are still defining what "production" means for agents, start with what is a production AI agent.
FAQ
Usually no. Store hashes, truncated spans, or metadata unless you are actively investigating. Full prompts and completions are sensitive and expensive; keep them under a short, explicit retention window when you need them at all. That stance aligns with OTel's default-off content capture for GenAI telemetry ([OTel GenAI observability](https://opentelemetry.io/blog/2026/genai-observability/)).